Filter, Find, Fix — say hello to your API and SMTP Logs tab
Our Product team has been hard at work to bring you a shiny upgrade for your Logs page with the new API & SMTP Logs tab. Available to our Professional and Enterprise customers, this update gives you advanced requests tracking and detailed logs so you have deeper insights into your API and SMTP activities.
We’ve also decluttered the page by adding a separate Template Errors tab, available to all customers, where you can easily access any Twig errors.
We’ll walk you through the new API & SMTP Logs tab and reveal how the humble Logs page can streamline your debugging process, monitor your quota usage, and help keep your account secure.
Get granular insights and streamline your debugging process
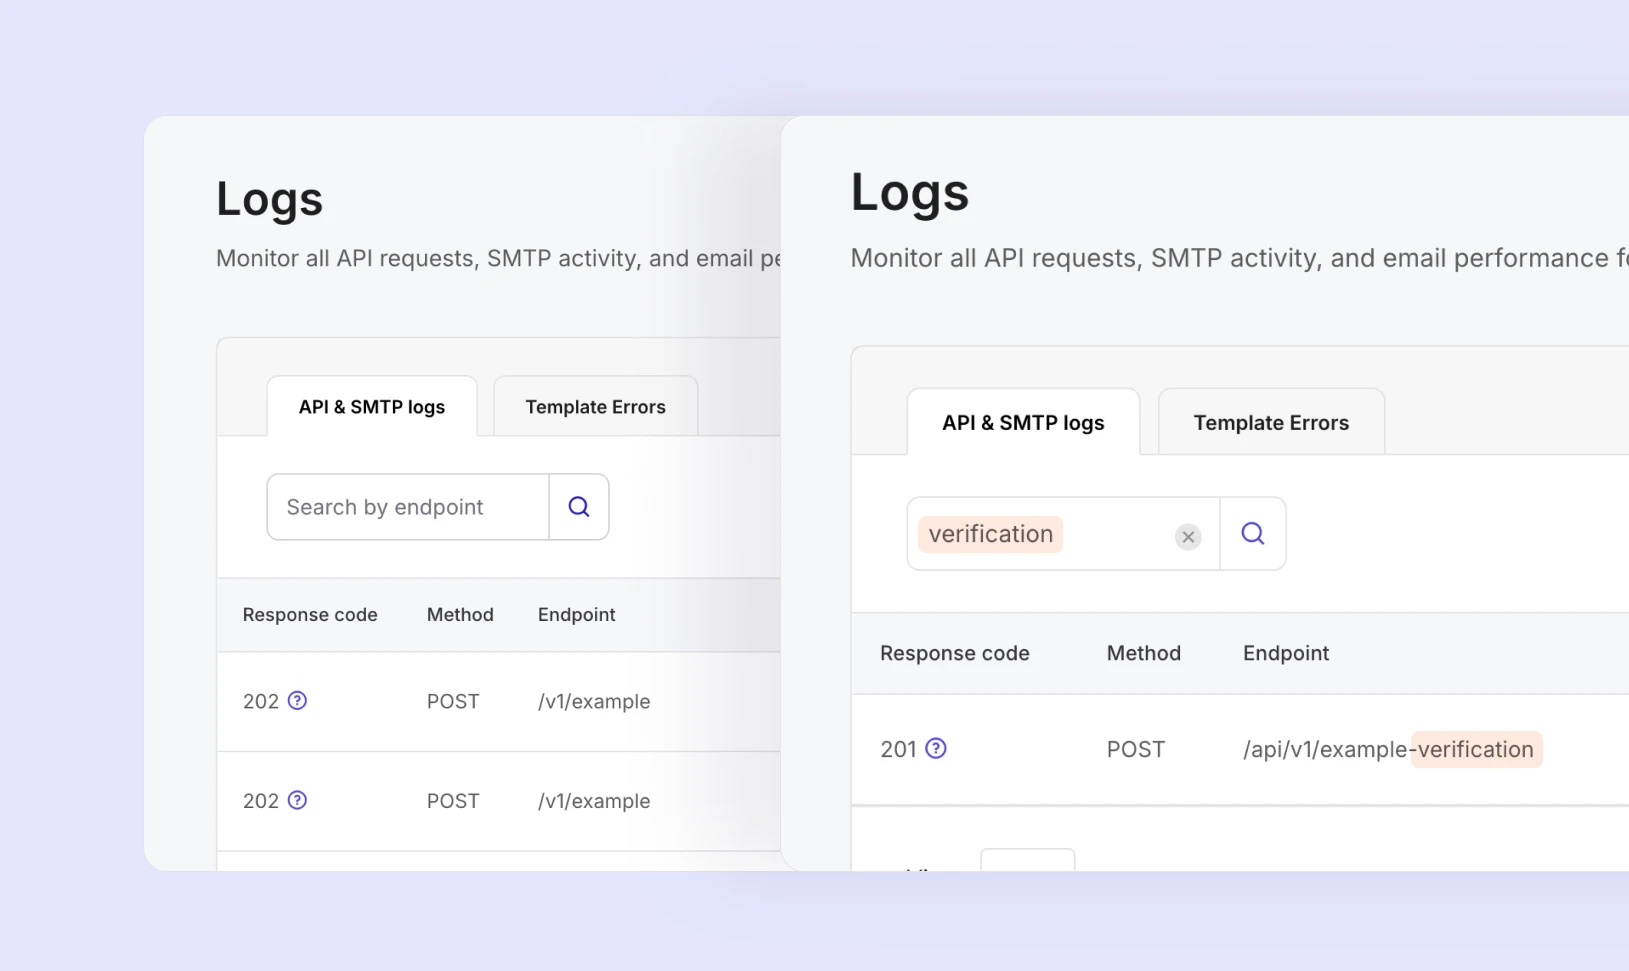
The new Logs page offers improved analytics to tighten up your monitoring and debugging efforts. You can track every request made with the API & SMTP Logs tab and view key details like response codes, endpoints, and timestamps.
In addition to tracking, the API & SMTP Logs tab speeds up your debugging process. By filtering your logs for failed requests, you can easily trace issues back to their source — whether it’s a code issue, configuration, or external dependency.
Your logs are accessible for 1 week if you’re on our Professional plan and 2 weeks if you’re on our Enterprise plan.
A closer look at the Logs page updates 🔎
Here’s how we’ve upgraded your Logs page.
The new API & SMTP Logs tab
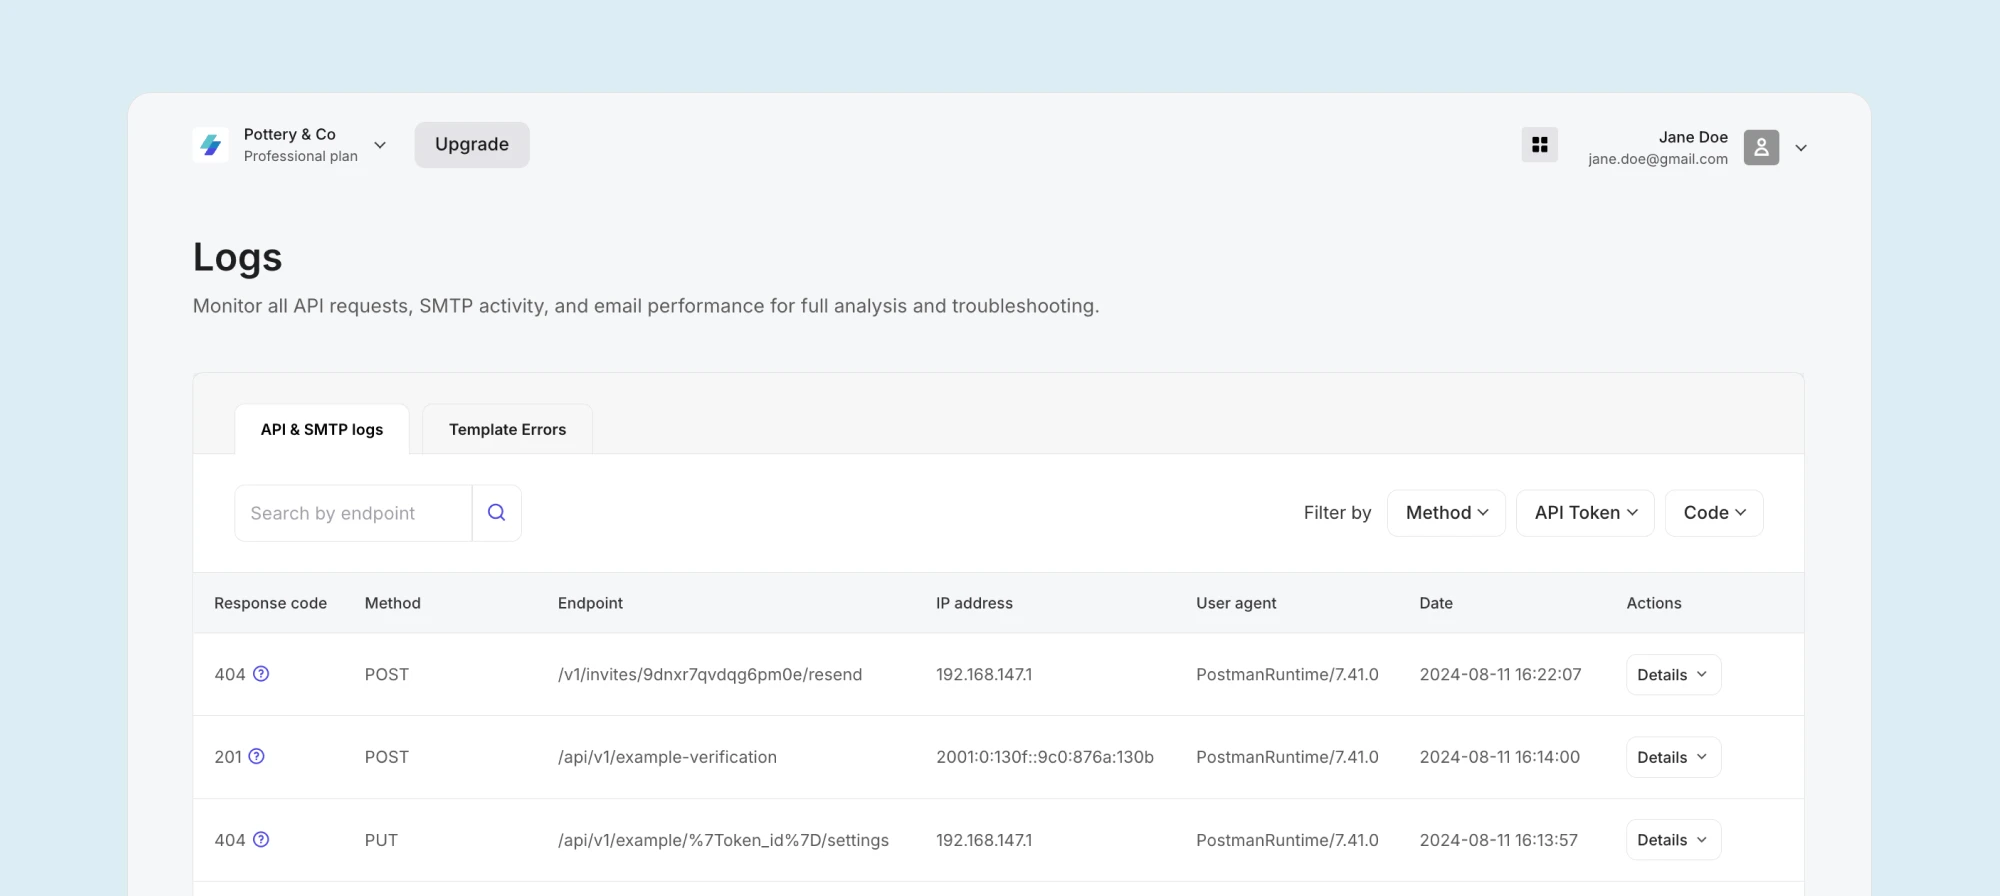
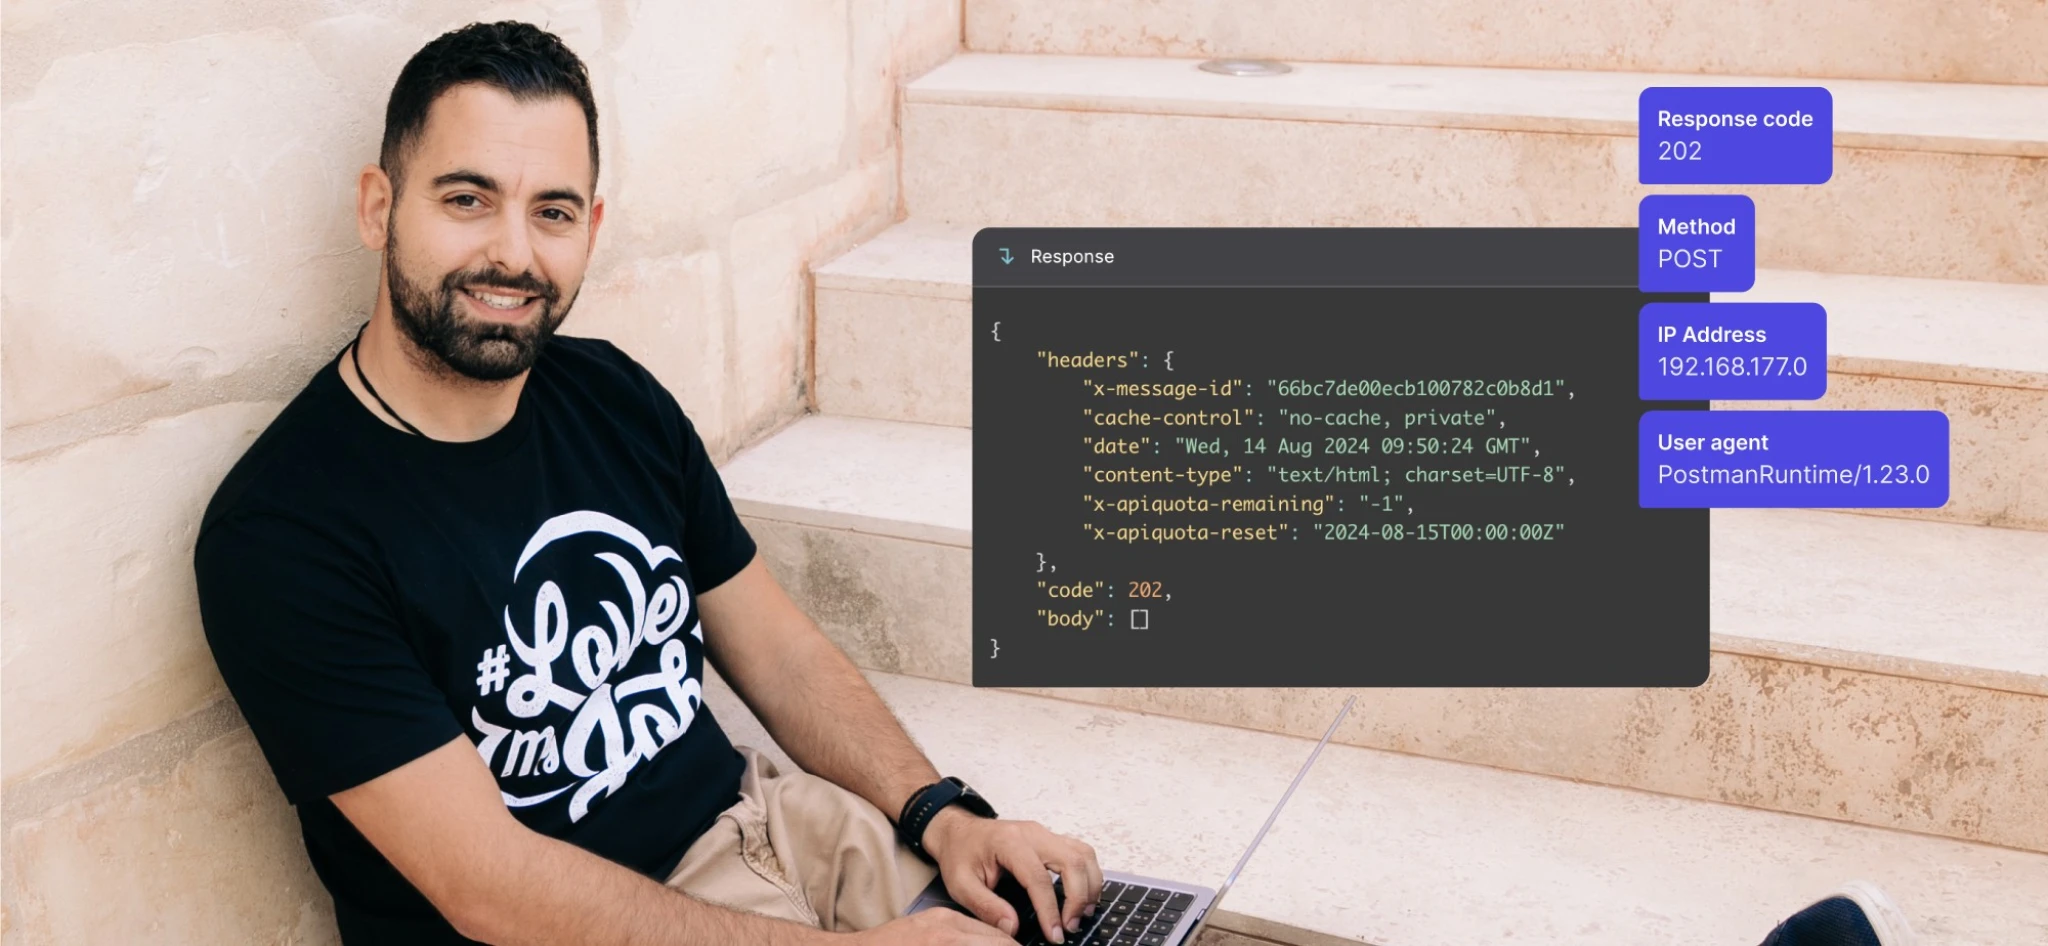
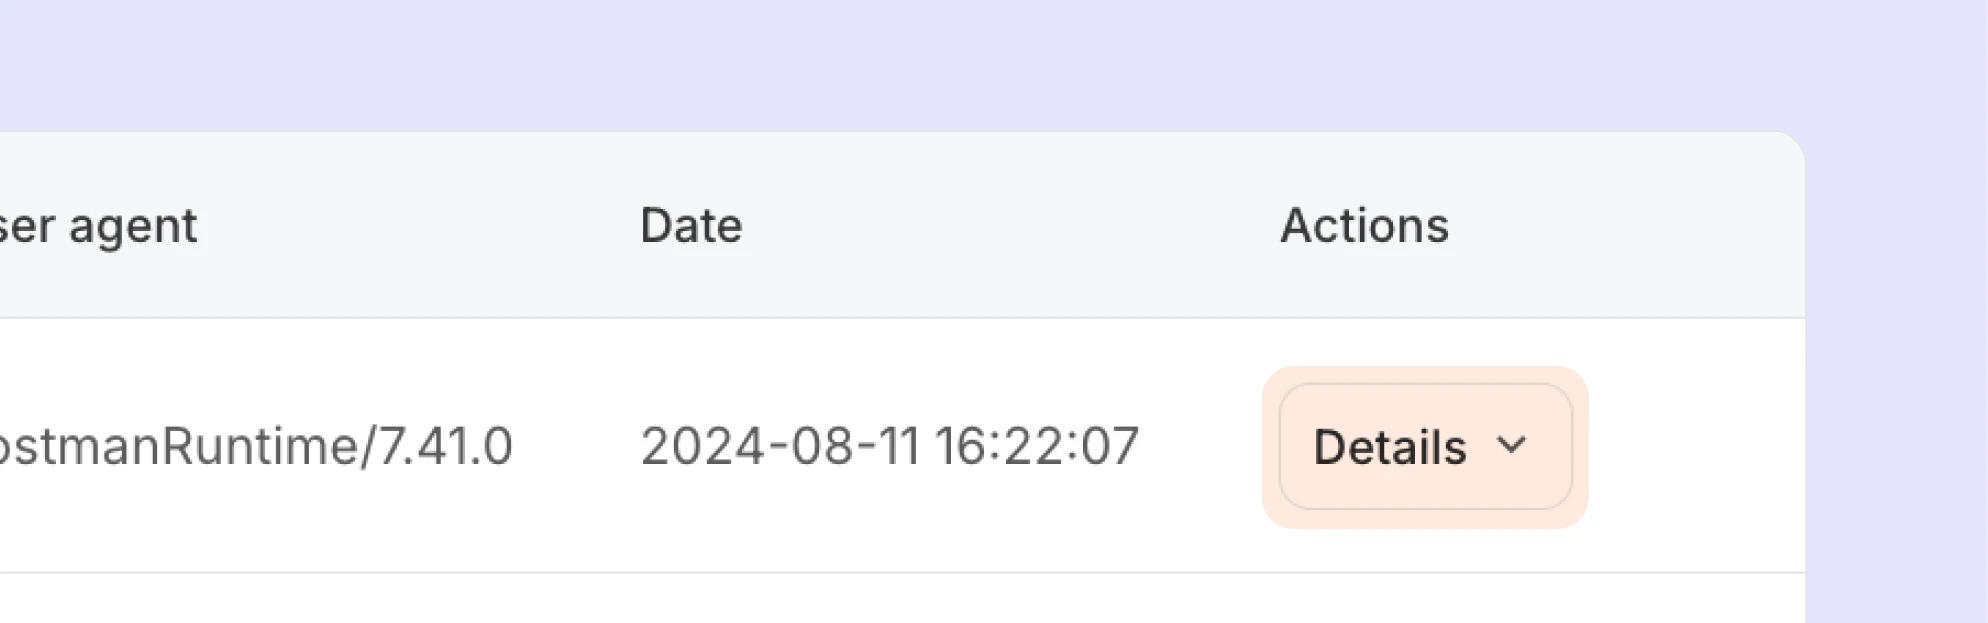
The API & SMTP Logs tab is the beating heart of your Logs page. Here, you’ll see a list of all your API and SMTP requests. Each log includes vital information about your requests such as:
Response code
Method
User Agent
Timestamp
IP Address
Response Details view
The tab also allows you to filter your logs so you can quickly find the ones you need.
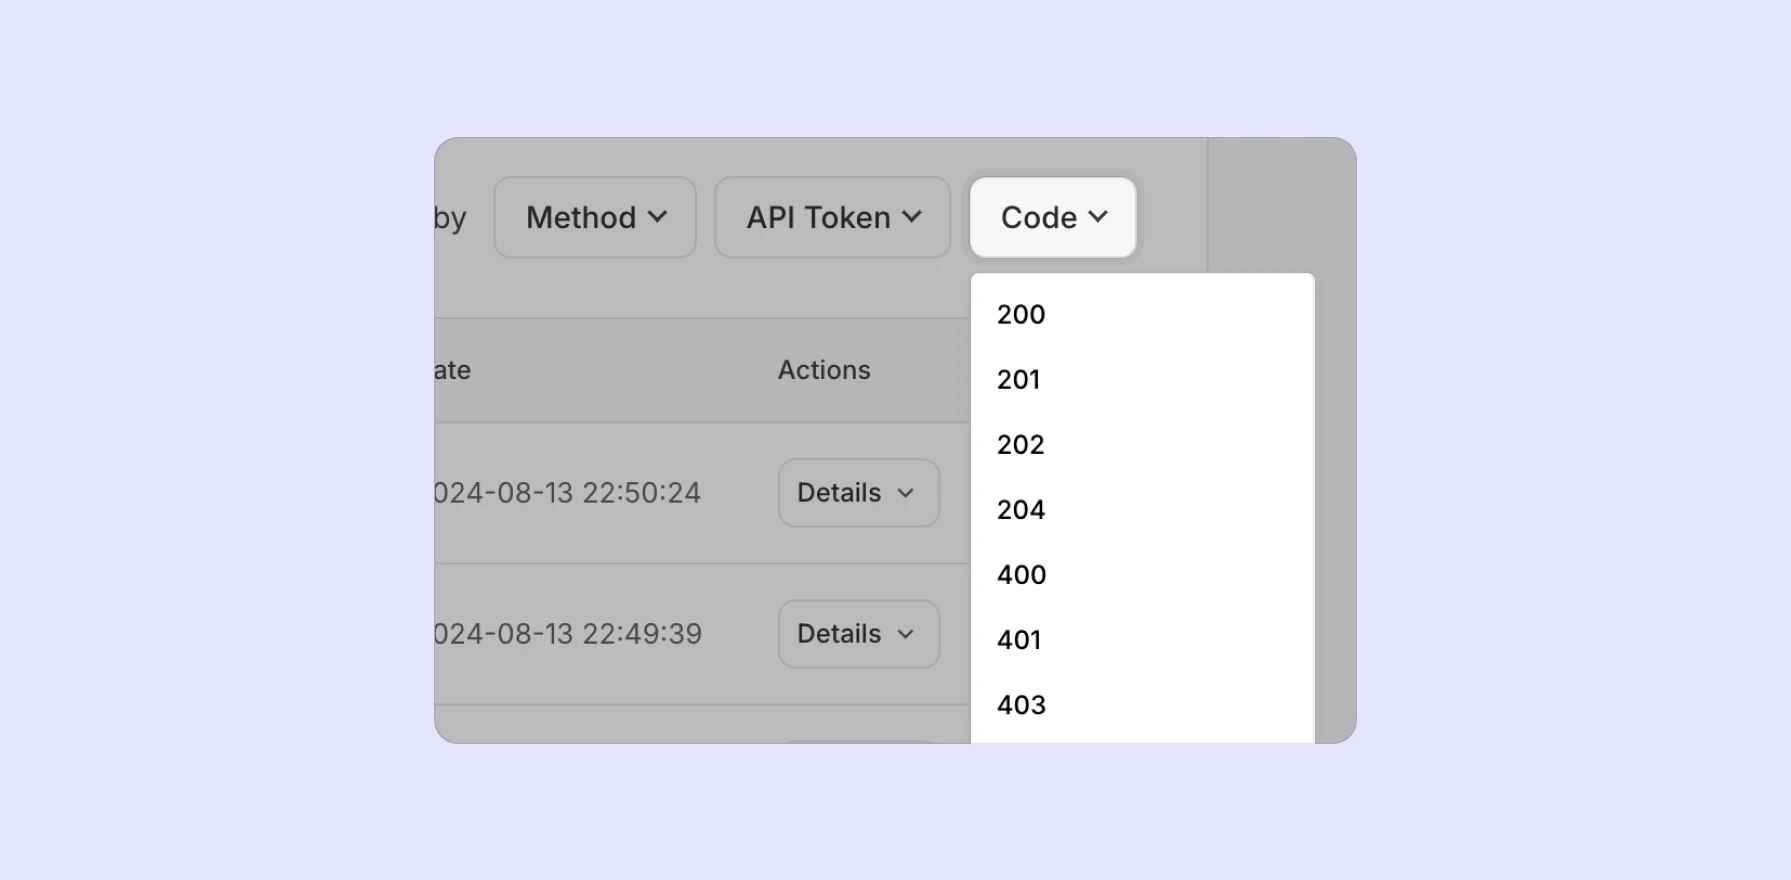
Filtering options
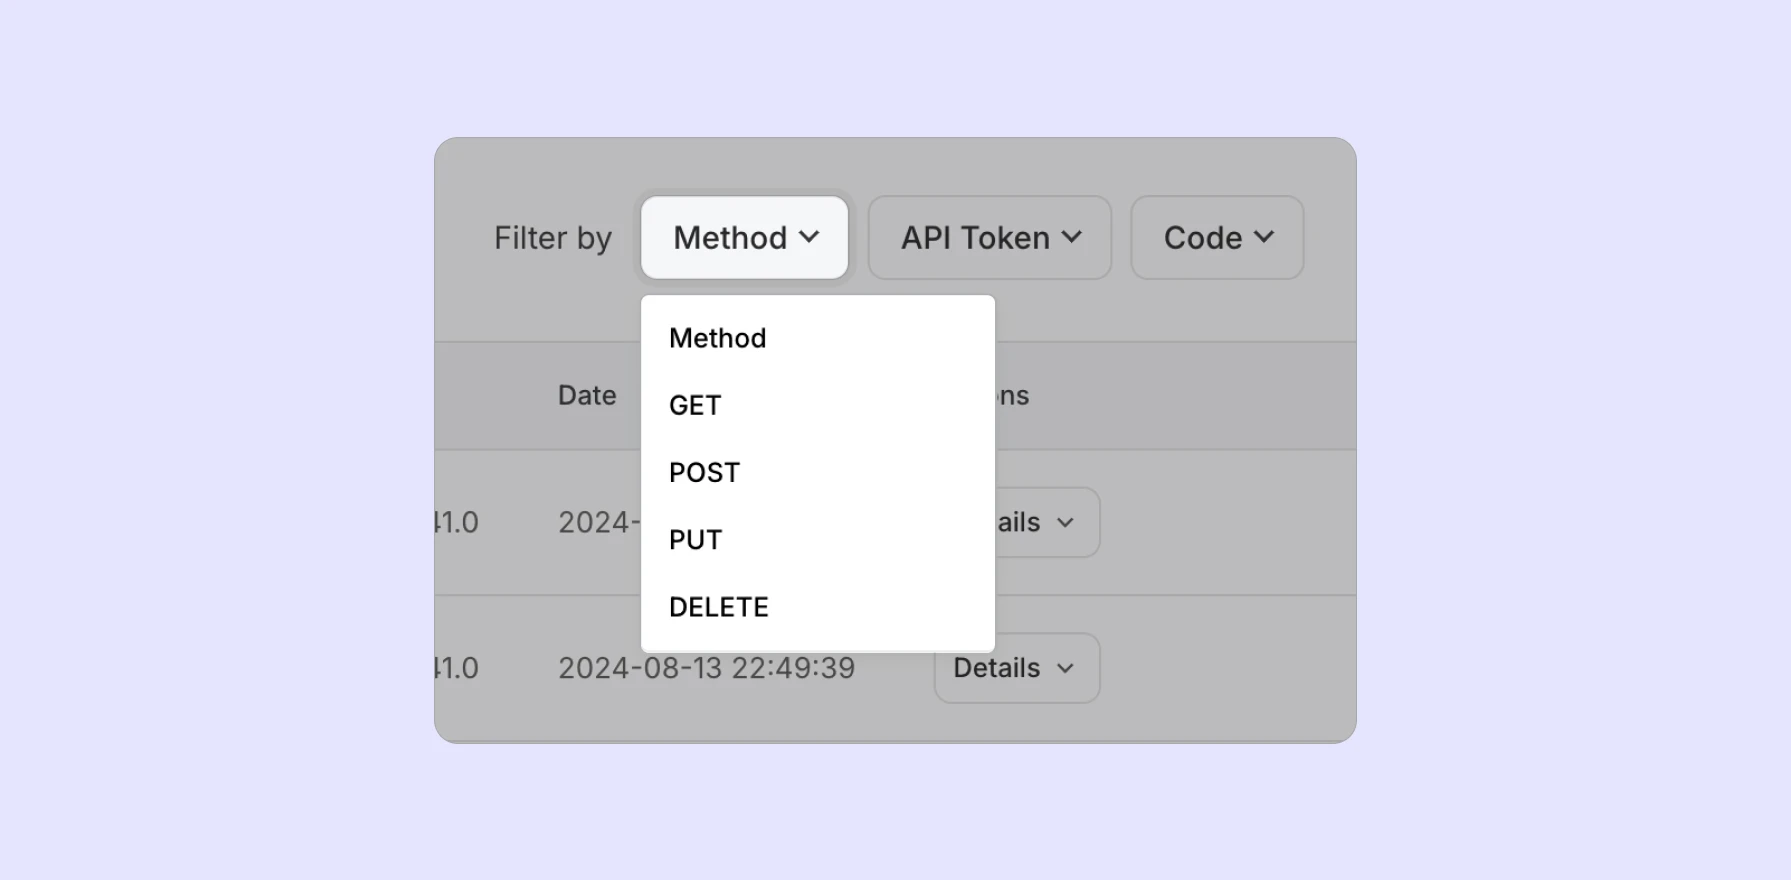
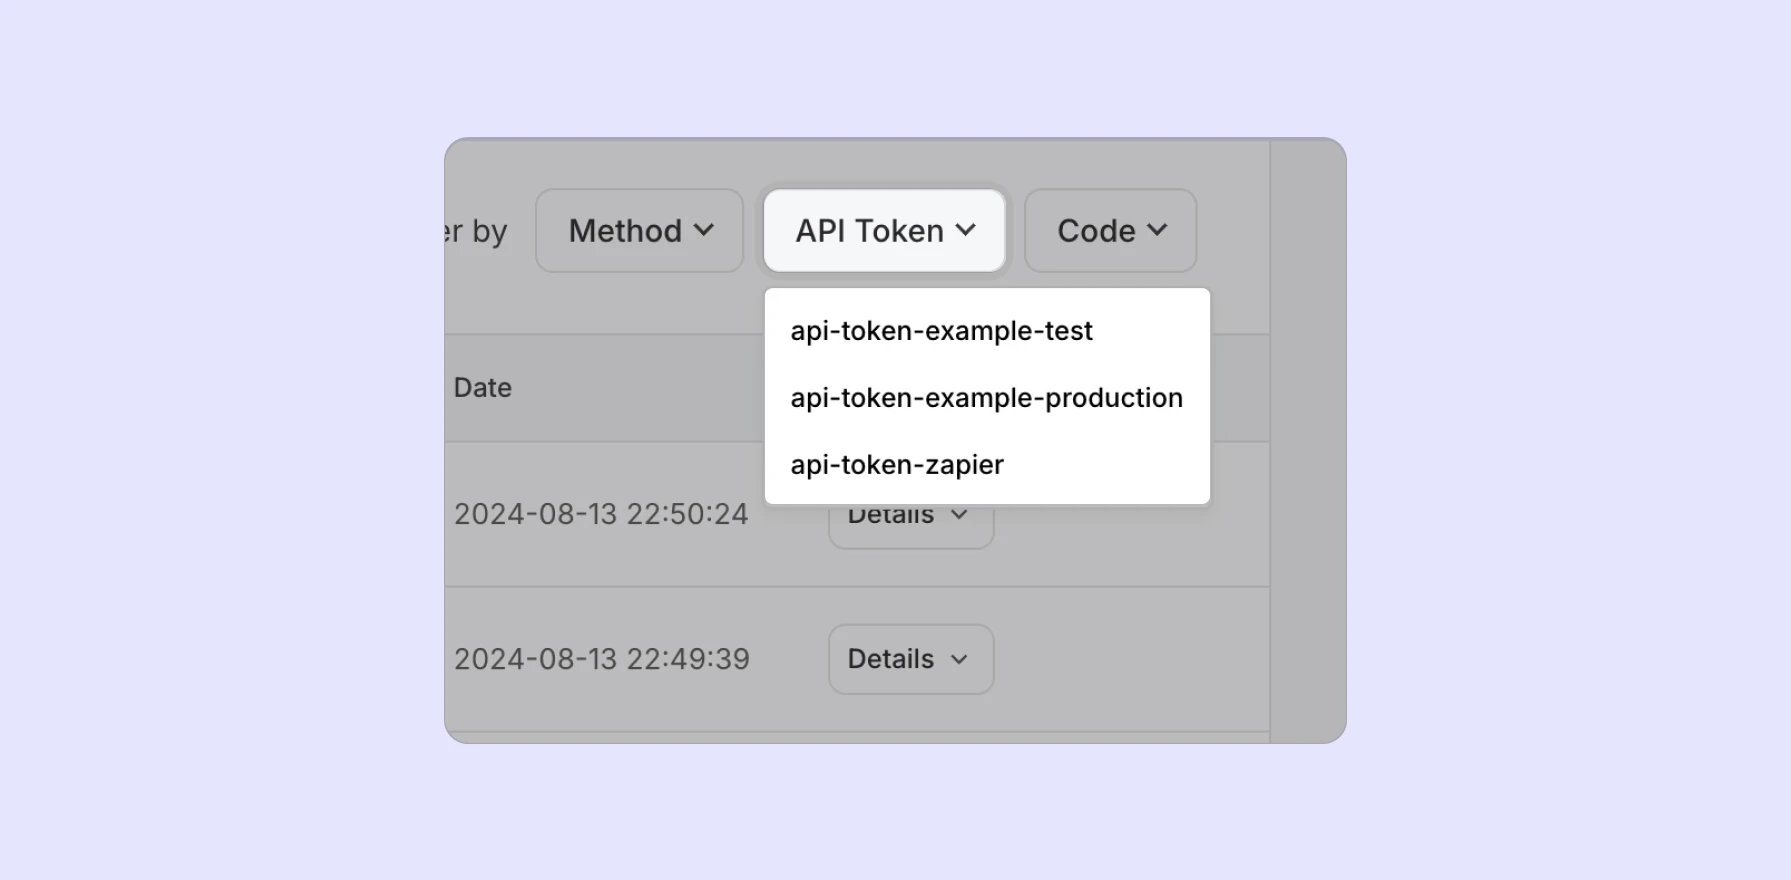
You can filter logs by Method, API token, Response Code, and Endpoint. This helps you focus on key issues, like all your 429 quota reached codes, without the clutter.
Detailed response information
When you click on a specific log entry, you can expand it using the Details button to get a detailed view of the response. This view includes both the request that was made and the response that was received, giving you full visibility into your requests.
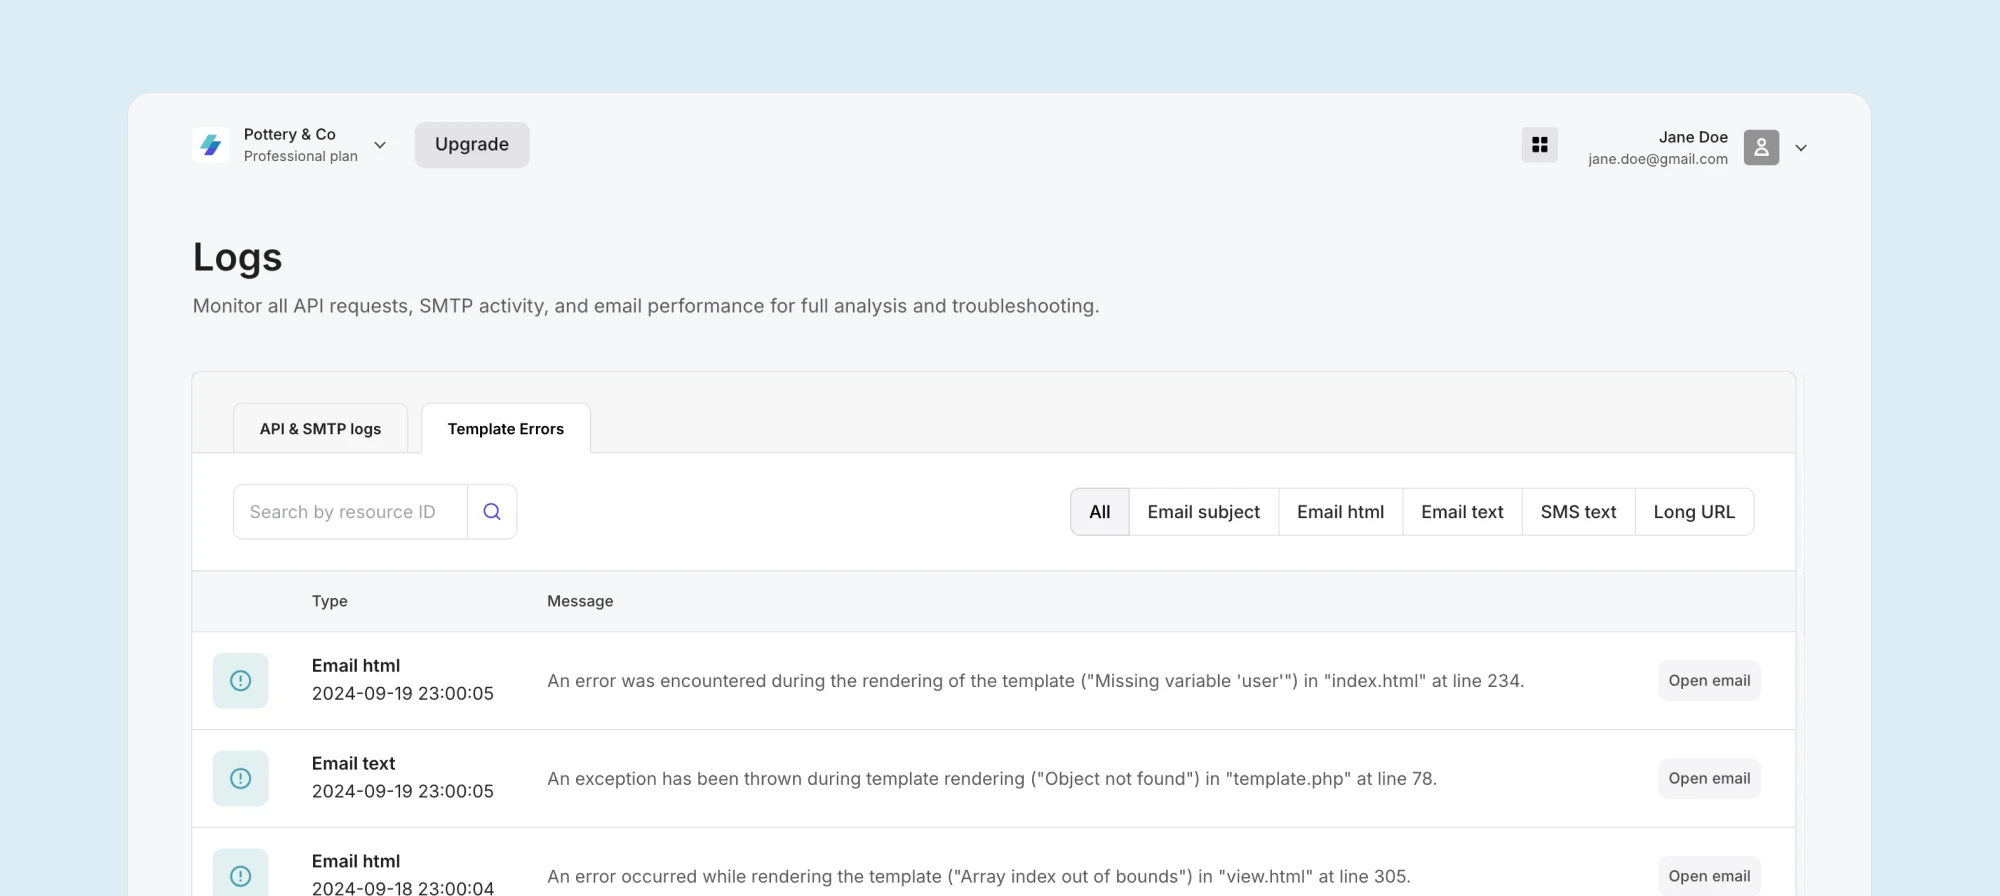
Twig Errors have moved to the Template Errors tab
The Template Errors tab is where you can now find any Twig errors that come from the variables you use in your email templates. This tab makes identifying Twig errors a breeze by identifying which line of code contains the error.
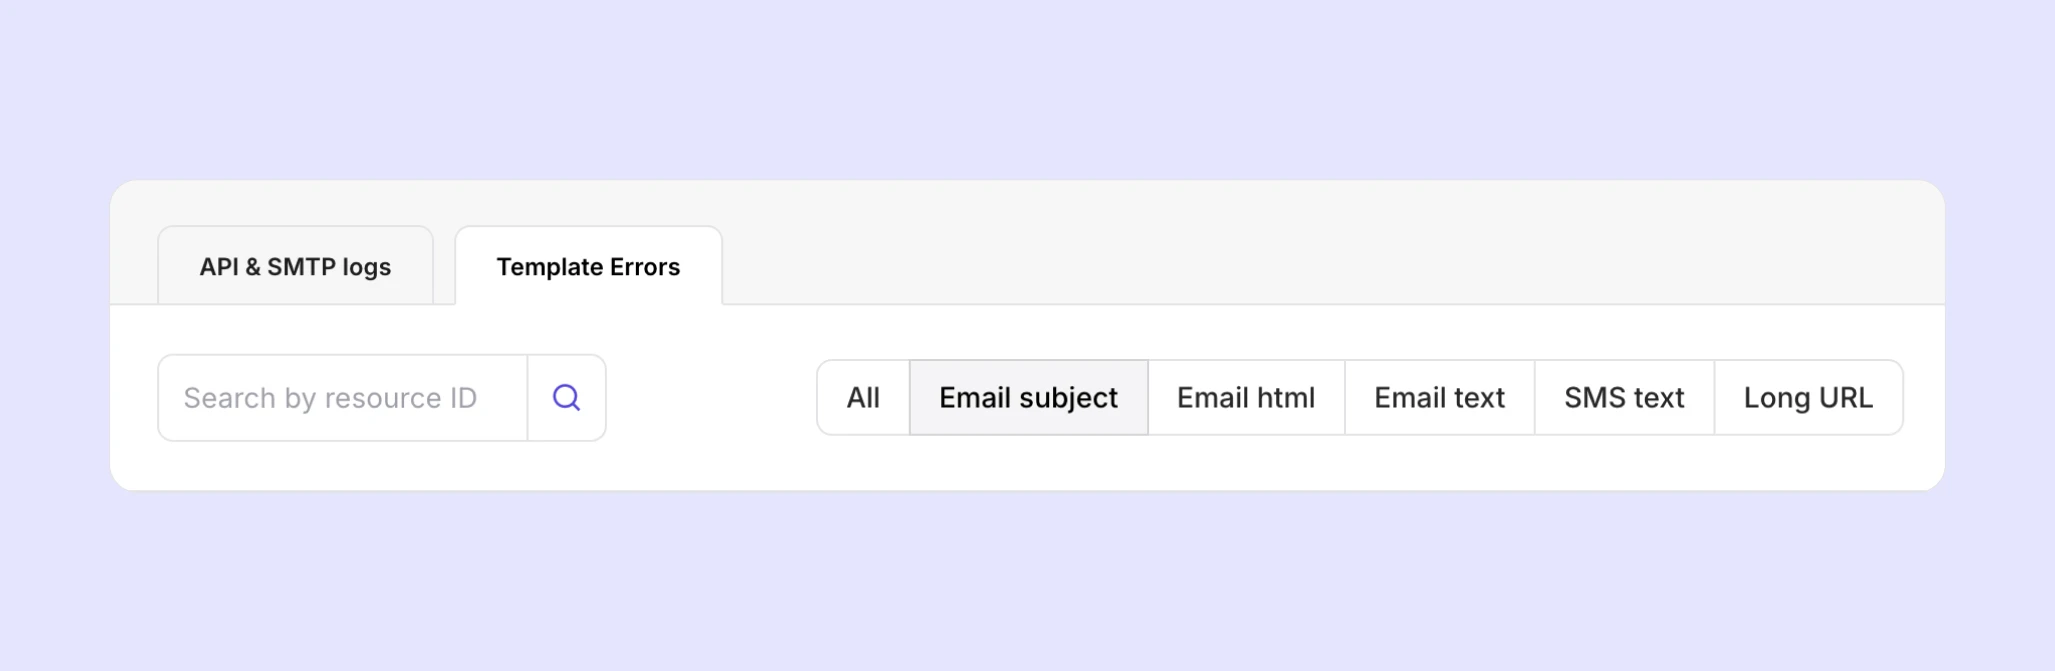
You can filter your Twig errors by:
Email subject
Email HTML
Email Text
Email SMS
Long URL
Once you’ve identified a Twig error, click Open Email and troubleshoot it. And good news — our Template Errors tab is available on all plans!
What the API & SMTP Logs tab helps you achieve
Comprehensive logs are the unsung heroes of your transactional email ecosystem. They help you with a range of tasks like; troubleshooting, security, and keeping an eye on your quota usage.
Here’s how.
Deeper insights into why a request wasn’t successful
A customer writes an angry tweet saying they haven’t heard back from you after requesting a password reset email. They’ve been locked out of their account for two days. What do you do? What happened?!
[API & SMTP Logs just entered the chat .😎]
Armed with the data from all your API and SMTP requests, you can now quickly identify the problem by filtering your requests by either API Tokens, Method or Code.
API Tokens: If you have multiple API tokens, you can filter logs by a specific token to gain insights into requests made with that particular token
Code: Filter your logs for 4XX error codes to check for failed requests
Method: Filter by POST methods so you’re only focusing on email delivery requests
You can then click Details to open detailed response information that shows you exactly what went wrong and why.
Keep an eye on your quota usage
We have a daily request quota for API and SMTP relay services which varies depending on your subscription plan.
If you’ve hit your rate limit, you’ll get a 429 error code. But with the help of the API & SMTP Logs tab, you can filter your requests by 429 status codes to better understand when you’re hitting your rate limits and adjust your plan or strategy accordingly.
Daily request quotas
In case you’re curious, here are our daily quota limits per plan.
Plan | Quota / day |
Trial | 100 |
Hobby | 1000 |
Starter | 100,000 |
Professional | 500,000 |
Enterprise | 500,000 |
Keep your account secure
We know security is important to you, that’s why the API & SMTP Logs make it easier to monitor who’s making requests. With visibility into User Agent and IP address you can sleep soundly knowing that no unauthorized servers are making requests. While we’re on the topic, give your account a security boost by adding trusted IPs to your allowlist. You can use this feature to guarantee that no unauthorized IP is able to send out requests.
Quickly test your implementation
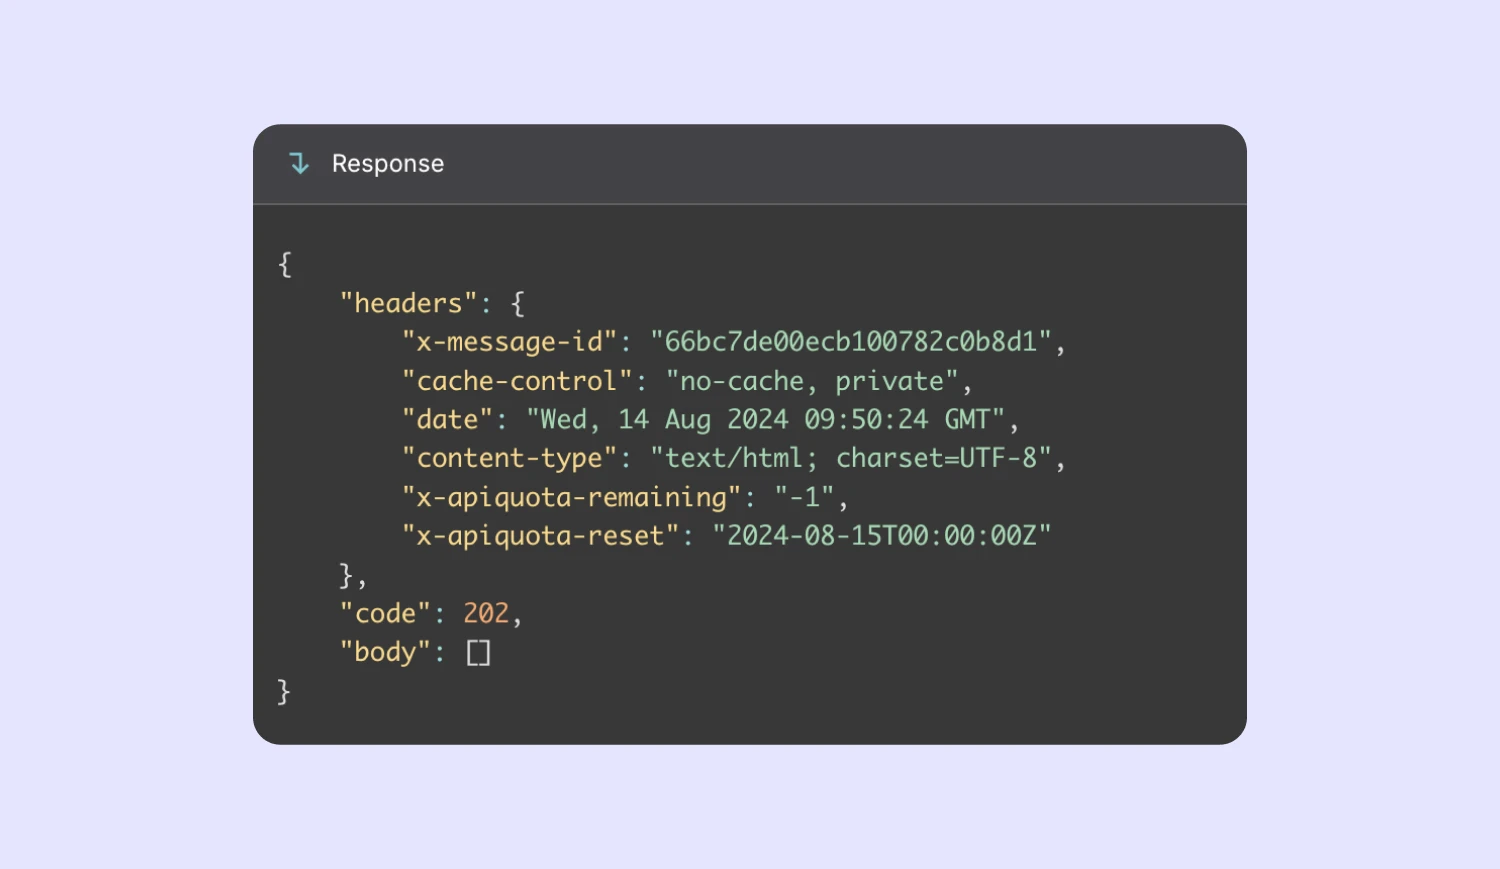
Let’s say you’re just starting your MailerSend journey (welcome aboard! 👋) and you want to check if everything is working seamlessly. You send a request from Insomnia using the GET method to our v1/identities endpoint to fetch all the identities on your account. You can see in Insomnia that you’ve got a 202 response code — great! Now let’s head over to MailerSend.
From your API & SMTP Logs, you can quickly see the request that you made and expand it using the Details button. Now you can cross-reference what you have in MailerSend and Insomnia.
How to access your API & SMTP Logs
The API & SMTP Logs feature is available to our Professional and Enterprise plan customers.
Here’s how to enable it:
Head to your Account Settings
Scroll down to Enable API Logging
Click the toggle bar
Click Update — don’t forget this bit!
Navigate to the Logs Page from your dashboard
Once enabled, you can say goodbye to guesswork with the data you need to track all your API & SMTP logs.
Enable your API & SMTP power-up today!
Are you already on a Professional or Enterprise plan? Then we encourage you to enable API & SMTP Logs today. If we’ve tempted you to take advantage of this feature and you’re considering an upgrade, here’s our pricing plans.
If you’ve got any questions, scroll a teeeeny bit more to check our FAQs. Can’t see your question? Reach out to us, we’d be happy to help.
FAQs
1. How long are logs retained?
Logs are stored for 1 week for Professional plan users and 2 weeks for Enterprise plan users. Find out more about our quotas here.
2. Which customers can access API & SMTP Logs?
API & SMTP Logs are available to our Professional and Enterprise plans.
3. Can I filter errors by specific API endpoints or response codes?
Yes, you can filter errors by response Code, API token, and Method. You can also use the Search by Endpoint feature to filter for specific API endpoints.
4. What happens if I downgrade my account from Professional or Enterprise?
Your logs will only be accessible for 1 week instead of 2 weeks, but your quota limits will stay the same. Get a full breakdown of our plans and features.
5. Can I use the API & SMTP Logs to monitor non-error requests?
Yep! The API & SMTP Logs tab includes all your requests, not just errored ones.